Overview Phase 1 — Assessment Phase 2 — Schema Conversion Phase 3 — Data Migration Phase 4 — Validation Phase 5 — Performance Phase 6 — Documentation
Phase 05 — Performance Baseline & Tuning

Baselining Performance, Investigating a Bottleneck

I baselined six representative queries against both systems, then investigated a real regression rather than looking away from it: SQL Server ran one join nearly 2× slower than PostgreSQL. Four different tuning attempts all confirmed the same honest conclusion.

6 Baseline Queries Execution Plans Index Tuning Structural Bottleneck

What I Did in Phase 5

I picked six queries covering different real-world access patterns — point lookup, filtered join, group-by aggregation, join with aggregation, filtered range scan, and a heavy join+aggregation+sort — and baselined every one against both PostgreSQL and SQL Server.

6
Queries Baselined
4 / 6
Faster on SQL Server
4
Tuning Attempts on Q2
Structural
Root Cause Found

Six Queries, Head to Head

QueryPatternPostgreSQLSQL ServerResult
Q1Point lookup13.2 ms50 msPostgreSQL faster
Q2Join + filter1,969.7 ms3,582 msInvestigated below
Q3Group-by aggregation162.2 ms109 ms33% faster
Q4Join + group-by1,515.0 ms967 ms36% faster
Q5Filtered range scan467.3 ms316 ms32% faster
Q6Heavy join + sort6,096.4 ms2,051 ms66% faster

Investigating the Q2 Regression

Q2 — filtering providers by state and joining to their services — was SQL Server's one real regression. I treated it as a genuine tuning problem, not noise, and tried four different fixes in order.

Attempt 01
Covering Index on Providers
Got the providers side down to a fast Index Seek, but provider_services still did a full scan. Elapsed time barely moved.
Attempt 02
Forced Loop Join
Made things worse — a Key Lookup run ~809,000 times cost more than the original scan it was meant to avoid.
Attempt 03
Covering Index on Provider Services
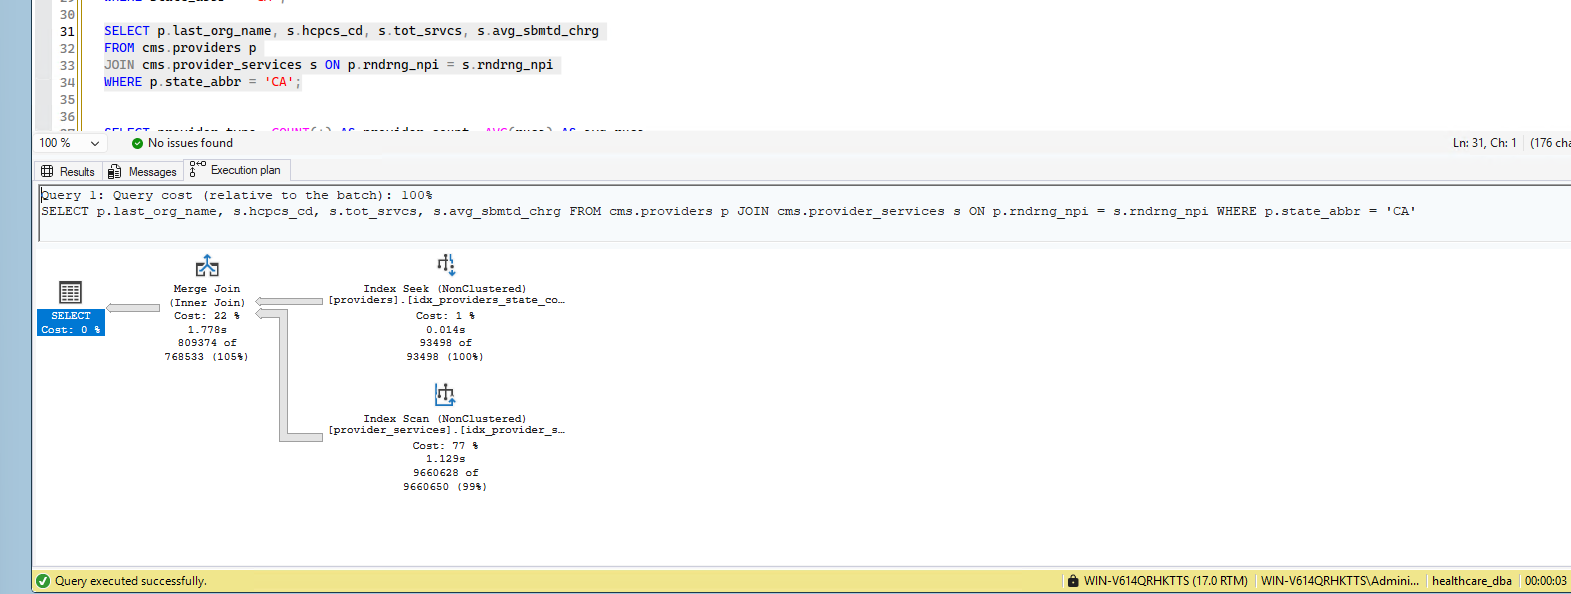
The optimizer switched to a Merge Join, but that needs sorted input — so it scanned nearly the whole table anyway.
Attempt 04
Filtered Index (state = 'CA')
The providers side was already free, so this gave the optimizer nothing new to improve. Unchanged.
Conclusion
All four attempts landed in the same ~3,480–3,710ms range — this isn't an indexing gap, it's structural. provider_services has no state_abbr column of its own, so matching any single state means touching a large, scattered fraction of a 9.66-million-row table clustered by id, not by provider. I documented this as a genuine finding rather than forcing an artificial fix.
Screenshot — Q2 Execution Plan Bottleneck
SQL Server execution plan showing a full index scan across 9.6 million rows of provider_services
The confirmed bottleneck — an Index Scan across 9,660,628 rows, 77% of query cost