By this point I had Always On, backups, security, and automation all working from Phase 9. What I didn't have was any real visibility into what the server was actually doing minute to minute — if a query started running slow or two transactions deadlocked each other, I'd have no way to know unless I happened to be watching. Phase 10 was about closing that gap: building a DMV-based query set for session/query/resource monitoring, and an Extended Events session that catches deadlocks and long-running queries as they happen, not after the fact.
I connected to 192.168.1.214 (SQLDBA-SECNDRY), which has been the AG primary since the Phase 9 failover test, and did everything against climate_dba from there.
1. Session-level monitoring — who's connected and how expensive
I started with the simplest layer: what's actually connected right now, and how much work each session has done.
SELECT
    session_id, login_name, host_name, program_name, status,
    cpu_time, memory_usage, reads, writes, logical_reads,
    last_request_start_time, last_request_end_time
FROM sys.dm_exec_sessions
WHERE is_user_process = 1
ORDER BY cpu_time DESC;
The output was unremarkable in a good way — my own SSMS sessions, plus SQL Server Agent's job invocation engine showing activity at 08:40:00, which lines up exactly with the Climate_DBA_Log_Backup job's 5-minute schedule from Phase 8. A small but useful confirmation that the automation is still ticking along in the background exactly as configured.
2. Query-level monitoring — what's actually expensive
Next I wanted to know which cached queries had done the most damage since the instance last started. The heaviest query by a wide margin was one I recognized immediately:
SELECT COUNT(*) AS total_rows FROM climate.daily_observations2 executions, ~7,413ms average CPU, ~861,329 average logical reads. I wasn't surprised — I documented back in Phase 4 that climate.daily_observations has a composite clustered index on (station_id, obs_date), so a query with no WHERE clause at all can't seek on anything and has to fully scan all 113,522,932 rows. That's not a bug, it's just the cost of a total count with no predicate on a table this size. Everything else in the top 10 was SSMS's own Object Explorer and IntelliSense background queries, which was a useful sanity check that this DMV cleanly separates real workload from tooling noise.
3. Resource-level monitoring — wait stats
The third lens was sys.dm_os_wait_stats, filtered down to strip out the usual idle/background wait types.
This surfaced something genuinely worth documenting: HADR_SYNC_COMMIT topped the list at 5,343,394ms across 26,478 waits, alongside HADR_WORK_QUEUE, HADR_TIMER_TASK, and HADR_NOTIFICATION_DEQUEUE. This is the real, measurable cost of running Always On AG with synchronous commit — every commit on the primary has to wait for the secondary to harden the log record before it can complete. It's not free, and now I have actual numbers proving it, tying directly back to the AG I built in Phase 9. VDI_CLIENT_OTHER lined up with the constant 5-minute log backup job (backups use the VDI API), and the QDS_* waits were just Query Store's own background housekeeping.
4. Building the Extended Events session
DMV snapshots only show what's happened cumulatively or what's happening right now — they won't reliably catch a one-off deadlock or a single slow query after it's already finished. For that I built an Extended Events session covering both cases the phase called for:
CREATE EVENT SESSION [ClimateDBA_Monitoring] ON SERVER
ADD EVENT sqlserver.xml_deadlock_report,
ADD EVENT sqlserver.sql_statement_completed(
    ACTION(sqlserver.sql_text, sqlserver.session_id, sqlserver.username, sqlserver.database_name)
    WHERE ([sqlserver].[database_name] = N'climate_dba' AND duration > 1000000)
)
ADD TARGET package0.event_file(
    SET filename = N'C:\ClimateData\ClimateDBA_Monitoring.xel',
    max_file_size = 50, max_rollover_files = 5
)
WITH (MAX_MEMORY = 4096 KB, EVENT_RETENTION_MODE = ALLOW_SINGLE_EVENT_LOSS, MAX_DISPATCH_LATENCY = 5 SECONDS);

ALTER EVENT SESSION [ClimateDBA_Monitoring] ON SERVER STATE = START;
I set the long-running-query threshold at 1 second (duration > 1000000 microseconds), scoped to climate_dba only so I wasn't picking up noise from other databases on the instance. I verified it came up correctly, active and writing to C:\ClimateData\ClimateDBA_Monitoring_0_134292088095250000.xel.
5. Real problem: my first capture attempt came back empty
I wanted to prove this actually works rather than just assume it does. I re-ran the same COUNT(*) full-scan query I'd already seen take over 7 seconds, expecting it to trip the 1-second threshold again, then queried the .xel file for sql_statement_completed events.
Nothing came back. Zero rows.
Before assuming the session itself was broken, I checked the query's actual last-execution timing instead of the cumulative average. That's when it made sense: the standalone re-run had completed in 748.57ms — under my 1-second threshold. The original run took 5.9–7.4 seconds because it had to physically read all 113.5M rows' worth of pages off disk. By the time I ran it again, the buffer pool had those same pages cached in memory, so the identical scan finished about 10x faster.
DBCC DROPCLEANBUFFERS — a standard technique for reproducing cold-cache behavior, something I'd only ever run in this lab, never against a production system.DBCC DROPCLEANBUFFERS;
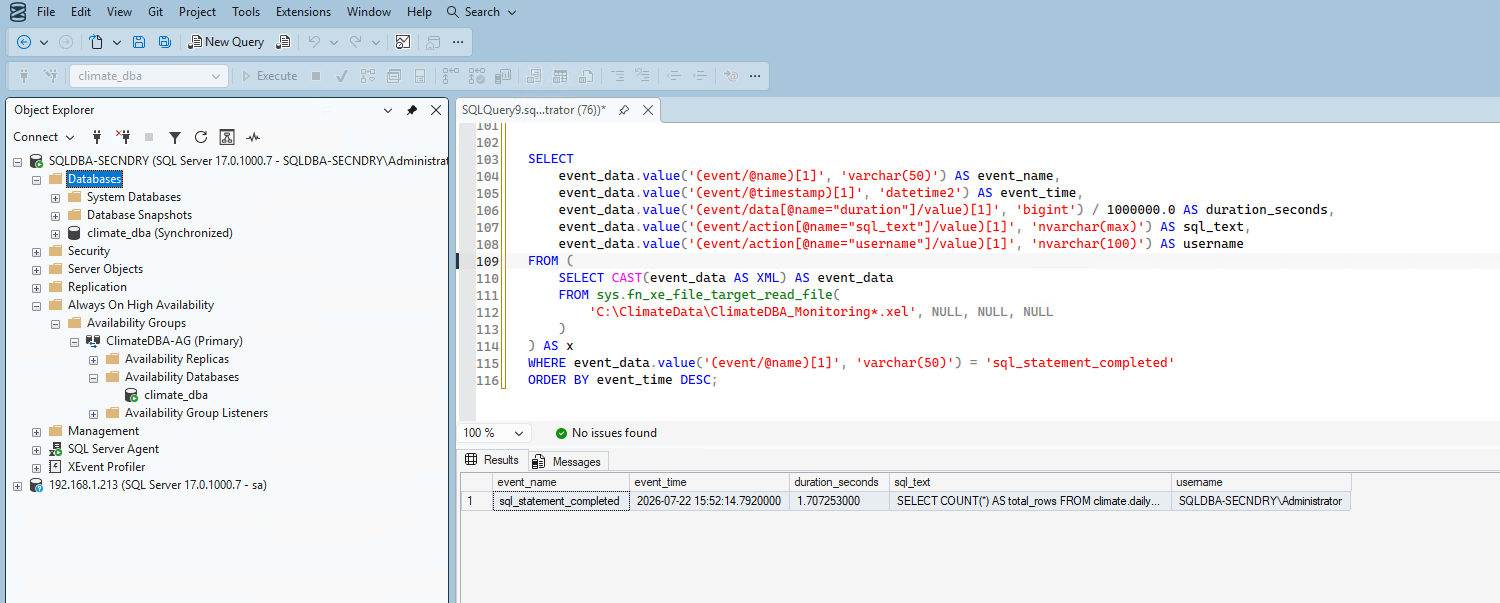
SELECT COUNT(*) AS total_rows FROM climate.daily_observations;Re-reading the file target this time gave me a real captured row: event time 2026-07-22 15:52:14.792, duration 1.707253 seconds, correct query text, correct login. The monitoring works.
6. Proving deadlock capture with a real deadlock
The session also had xml_deadlock_report wired up, and I didn't want to leave that half unverified. I set up two small test tables and opened a second SSMS window, then deliberately created a circular lock wait: one window locked table B then tried to lock table A (which the other window already held), while the other window tried to lock table B back — closing the cycle.
Within a couple of seconds, SQL Server's deadlock monitor caught the circular wait and killed one side of it automatically:
Msg 1205, Level 13, State 51, Line 14
Transaction (Process ID 95) was deadlocked on lock resources with another process
and has been chosen as the deadlock victim. Rerun the transaction.
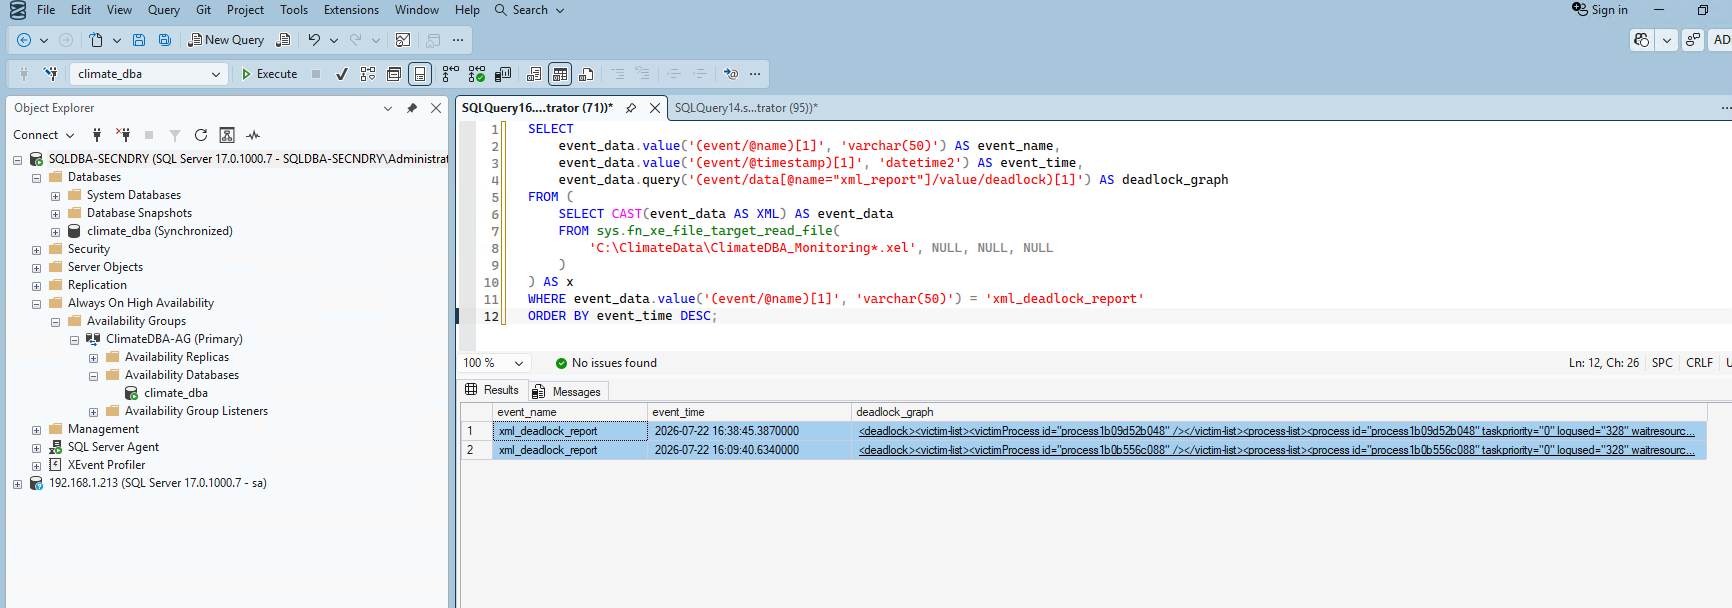
The other window's blocked UPDATE then completed normally as soon as the lock released. Pulling the deadlock graph out of the .xel file confirmed everything I'd expect from a textbook deadlock — a clean circular wait, captured exactly as it happened.
I actually ran this test twice — the first time to confirm the capture worked at all, and a second time to get a clean screenshot. The results grid below shows both events captured independently, which is itself good evidence: the session isn't a one-off fluke, it reliably catches every deadlock, not just the first one.
I committed the surviving transaction and dropped both test tables once I was done.
Honest limitation carried forward
This monitoring is entirely pull-based. Nothing here pushes an alert by email, because Database Mail was never configured in this lab (no real SMTP server available in this workgroup environment, documented back in Phase 8). Catching a deadlock or a slow query still means someone runs these queries or reads the .xel file. That's a real constraint of this environment, not something I'm papering over.
Summary
| Item | Status | Real issue encountered |
|---|---|---|
| Session-level monitoring | ✅ Complete | None |
| Query-level monitoring | ✅ Complete | None — confirmed known full-scan behavior from Phase 4 |
| Wait-stats monitoring | ✅ Complete | None — surfaced real AG synchronous-commit overhead |
| Extended Events session (deadlocks + long queries) | ✅ Complete | None |
| Long-running query capture | ✅ Verified with real event | First attempt returned zero rows — buffer cache had warmed up between runs, dropping the query under threshold; resolved by forcing a cold cache with DBCC DROPCLEANBUFFERS |
| Deadlock capture | ✅ Verified with real event (twice) | None |
What's Next
With monitoring in place and proven against real events, only Phase 11 — Documentation & Portfolio Packaging remains, pulling all eleven phases together into this portfolio site.