Databricks Lakehouse · End-to-End Data Engineering

Cancer & Environment
Lakehouse

An end-to-end Databricks Lakehouse project I built to investigate potential associations between U.S. cancer rates and environmental, lifestyle, and water quality factors. I ingested 52.8 million rows across 33 Delta tables, built a full Medallion Architecture pipeline, trained ML models, and published interactive Tableau dashboards.

Apache Spark Delta Lake Unity Catalog Python scikit-learn Tableau Public EPA / CDC / USDA Data
52.8M Rows Ingested
33 Delta Tables
23 Notebooks
3 Tableau Dashboards
0.81 ML R² Score

Medallion Architecture

I built this project following the Medallion Architecture pattern — Bronze, Silver, and Gold Delta Lake layers — with a full analytics and ML phase on top. Click any layer to explore every notebook with its complete code, outputs, and results.

What I Built & Why

I built this project to demonstrate end-to-end data engineering expertise on the Databricks Lakehouse Platform. Starting from the MySQL DBA predecessor project which established a 4.57 GB star-schema data warehouse, I re-ingested all datasets into Databricks using Apache Spark and Delta Lake for scalable analytics.

The core question I investigated: are there measurable associations between U.S. cancer rates and environmental, lifestyle, water quality, and food environment factors? I approached this as a data scientist — surfacing correlations without claiming causal conclusions.

The project covers the complete data engineering lifecycle — ingestion, validation, cleaning, transformation, aggregation, analytics, machine learning, and business intelligence — all built on a modern Lakehouse architecture with full pipeline orchestration.

I ingested data from 5 federal agencies: CDC/NCI SEER cancer registries, EPA Air Quality System, EPA Safe Drinking Water System (SDWIS), EPA ECHO NPDES permit system, and USDA Economic Research Service and Census of Agriculture.

The multi-factor correlation analysis revealed that lifestyle factors (COPD, smoking, obesity) show the strongest correlations with cancer mortality (r=0.885, 0.846, 0.780), while environmental factors contribute additional signal — particularly PM2.5 days which emerged as the most important feature in the Random Forest regression model.

The pipeline runs end-to-end in under 17 minutes on Databricks Free Edition serverless compute, processing 52.8 million rows across all layers.

End-to-End Pipeline

// cancer_environment_lakehouse pipeline — 16m 35s · 52.8M rows

Setup Unity Catalog · Schemas · Volumes
Bronze Raw CSV → Delta · 33 tables
Silver Cleaned · Typed · Validated
Gold Aggregated · Risk Profile
Analytics Correlations · Trends
ML Regression · Classifier
Tableau 3 Live Dashboards

10 Federal Datasets · 5 Agencies

# Dataset Source Bronze Rows Purpose
1Cancer Incidence by State (1999–2022)CDC WONDER1,307Primary outcome variable
2Cancer Mortality by State (2018–2023)CDC WONDER394Secondary outcome variable
3EPA Air Quality Index (2000–2022)EPA AQS24,488Air pollution exposure (23 annual files)
4CDC Chronic Disease IndicatorsCDC BRFSS398,793Lifestyle & behavioral risk factors
5SDWIS Water Violations & EnforcementEPA SDWIS15,298,031Drinking water health violations
6SDWIS Public Water Systems + 9 tablesEPA SDWIS7,130,425Water system inventory & facilities
7NPDES/CAFO Permits & Violations (15 tables)EPA ECHO22,959,739CAFO permits, inspections, enforcement
8USDA Food Environment AtlasUSDA ERS957,753Food access & insecurity indicators
9USDA Census of AgricultureUSDA NASS6,077,214Livestock & agricultural intensity
Total · 33 Bronze Delta Tables52,848,144

Project Screenshots

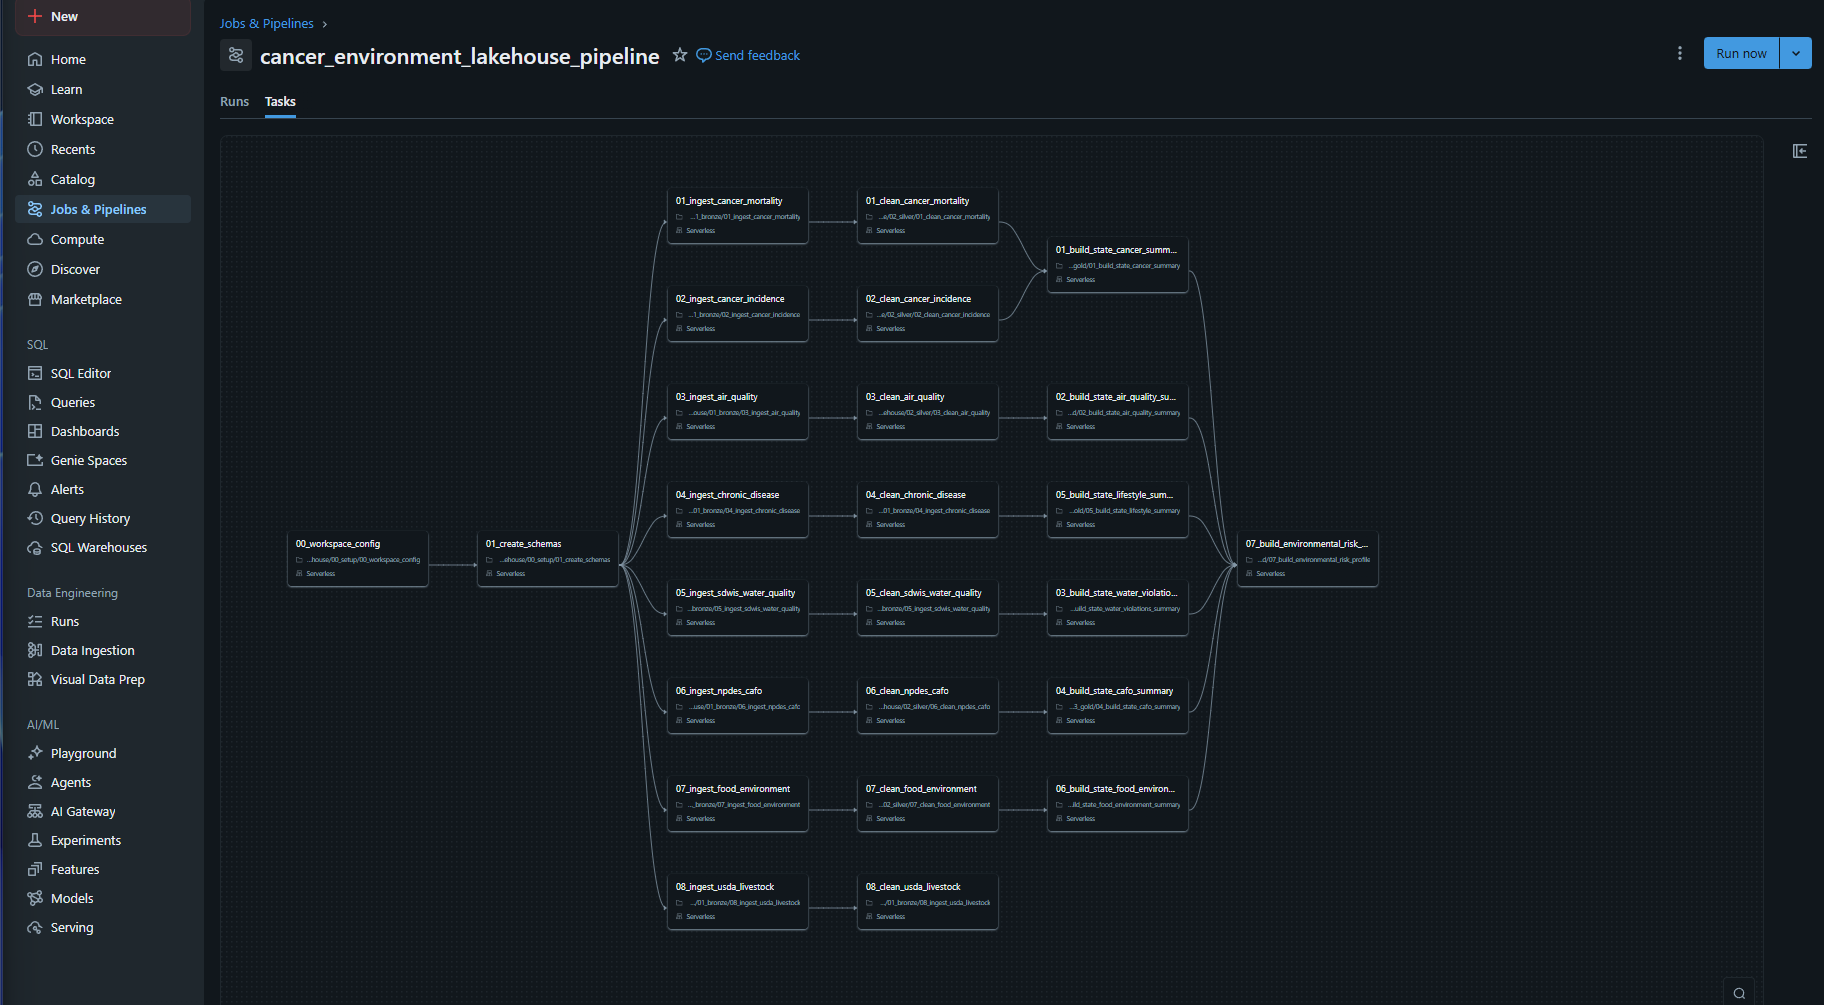
Pipeline DAG view showing all tasks connected
Pipeline DAG View

The complete Databricks Workflow showing all 25 tasks — setup, 8 Bronze, 8 Silver, and 7 Gold notebooks — connected with correct dependencies.
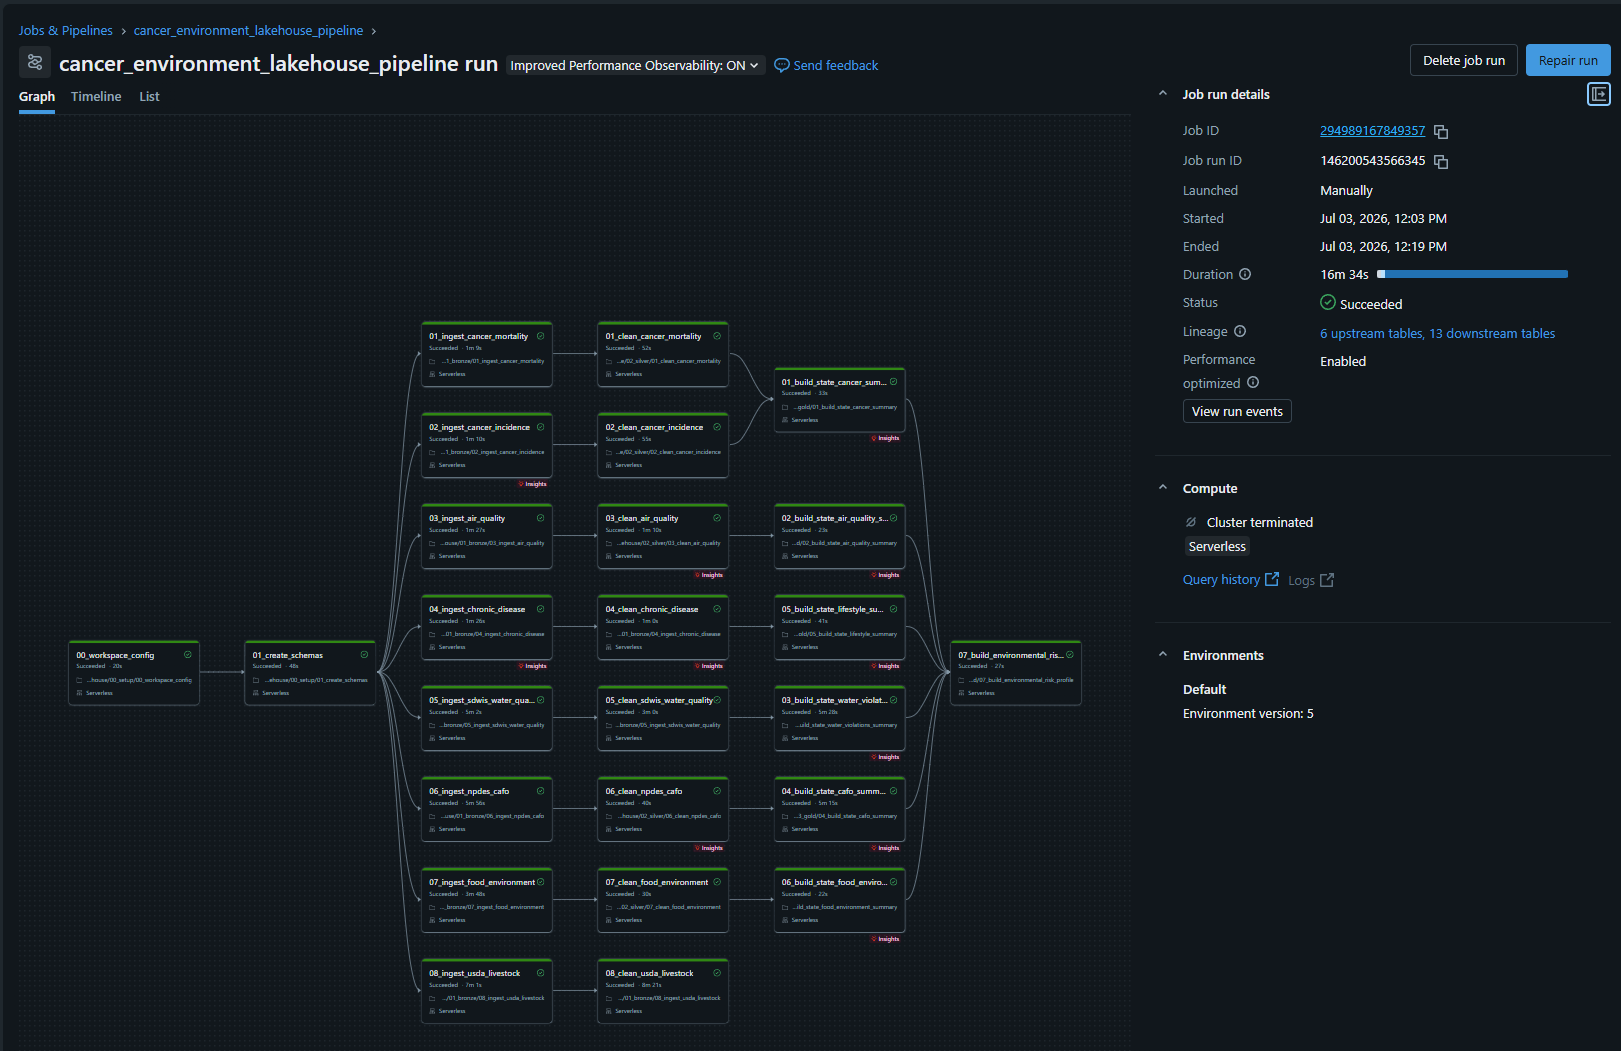
Pipeline completed successfully
Pipeline Execution — Succeeded

Full end-to-end pipeline run completing in 16 minutes 35 seconds on Databricks Free Edition serverless compute.
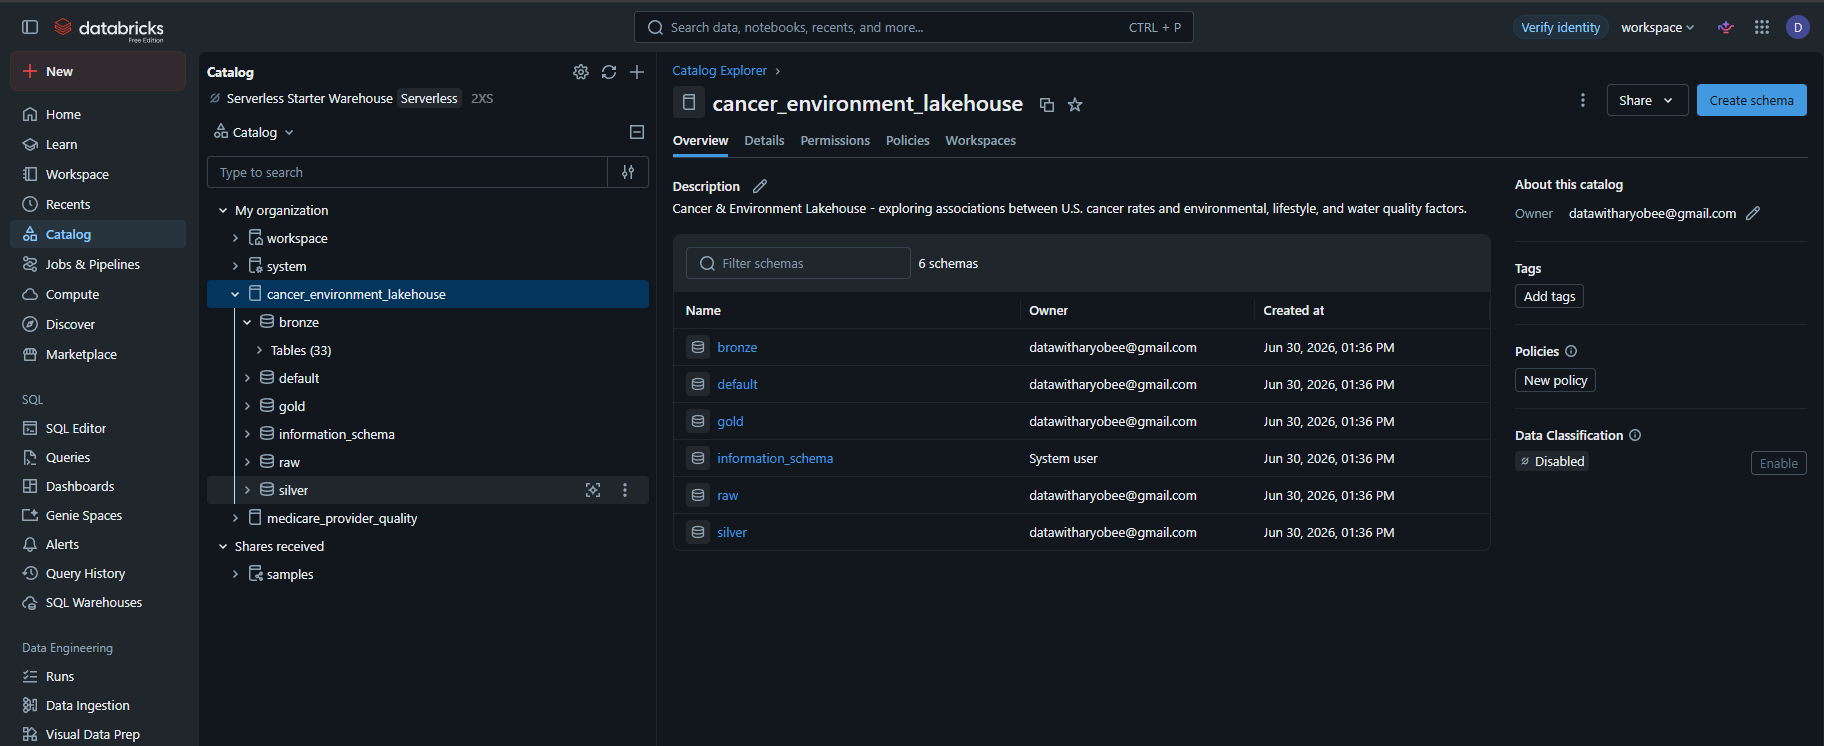
Unity Catalog showing all schemas
Unity Catalog — Lakehouse Structure

The cancer_environment_lakehouse catalog with Bronze, Silver, Gold, and Raw schemas — all created and managed through Unity Catalog.
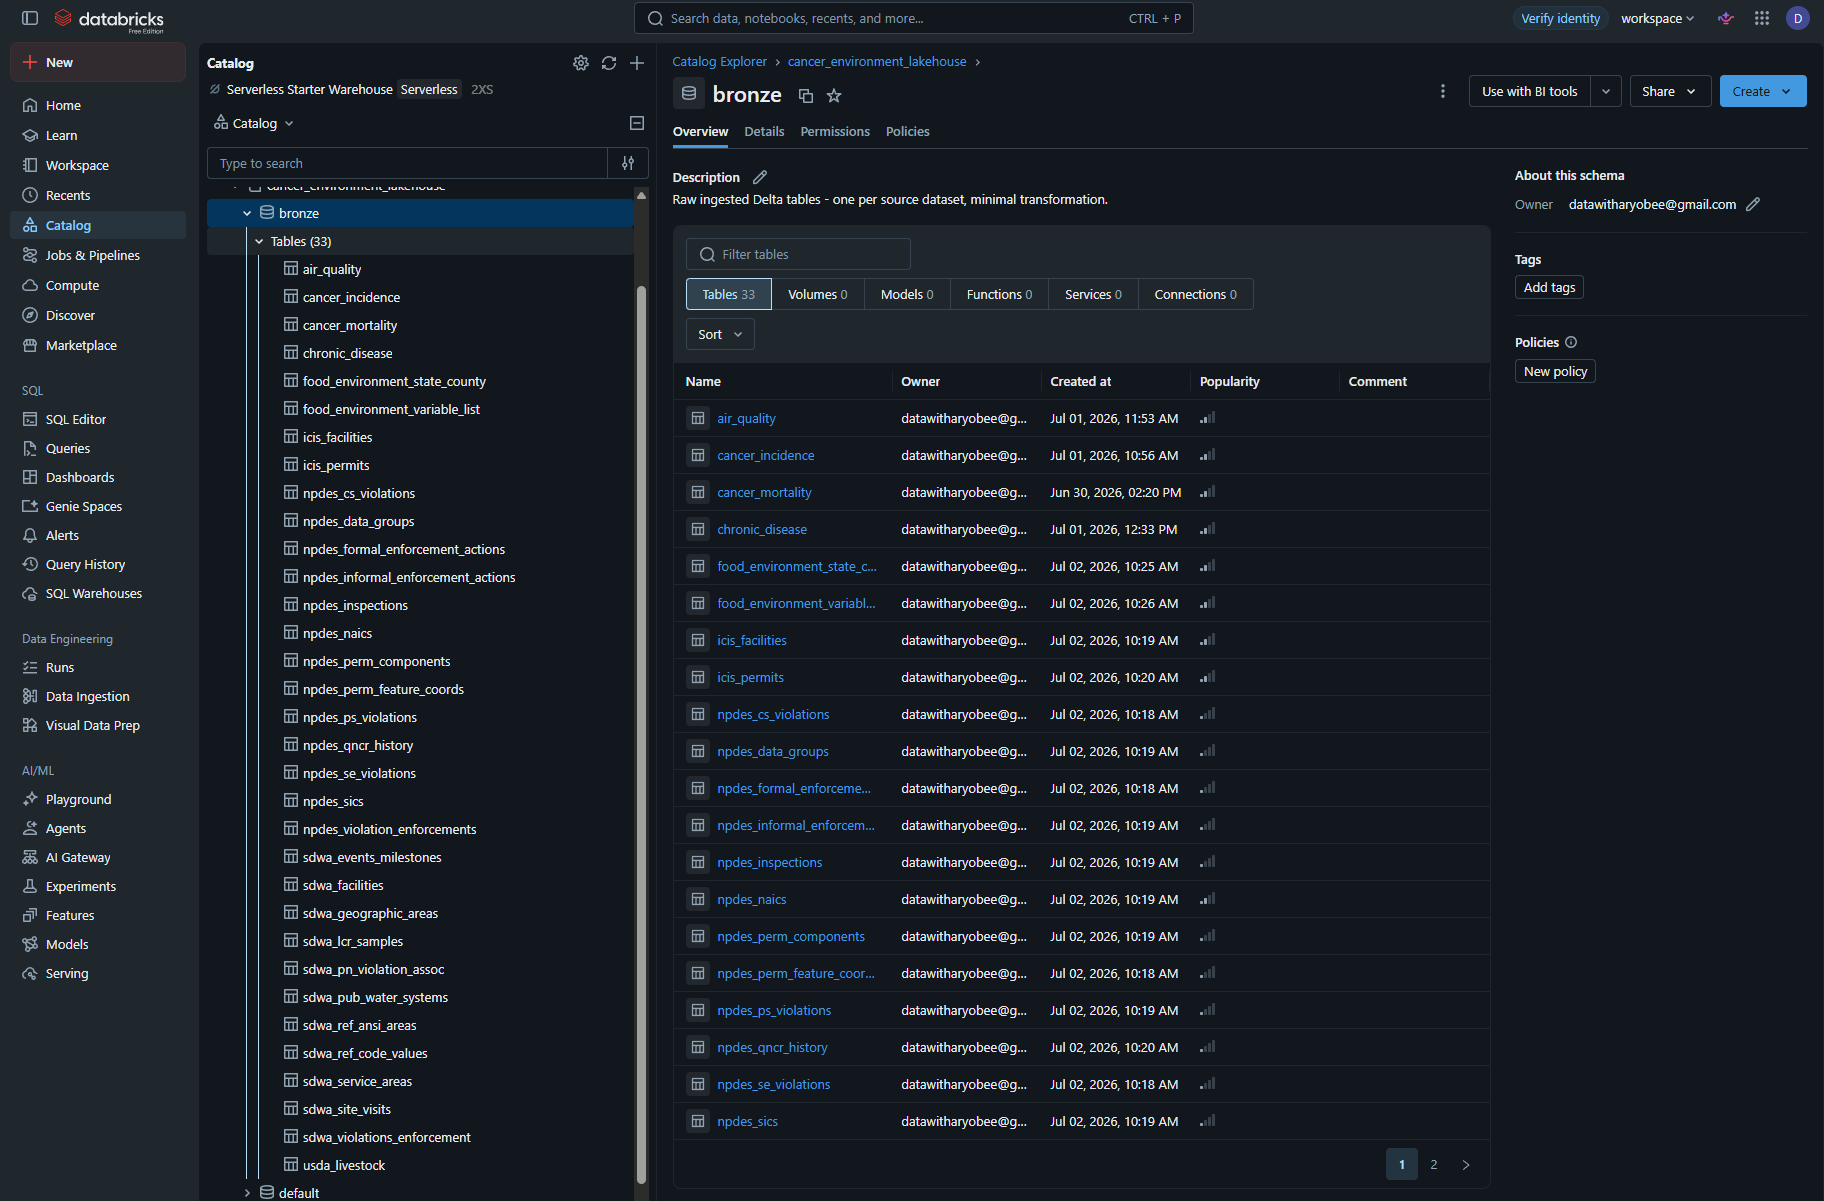
Bronze layer tables in catalog
Bronze Layer — 33 Delta Tables

All 33 Bronze Delta tables visible in the Unity Catalog, covering cancer, air quality, water, CAFO, food environment, and livestock data.
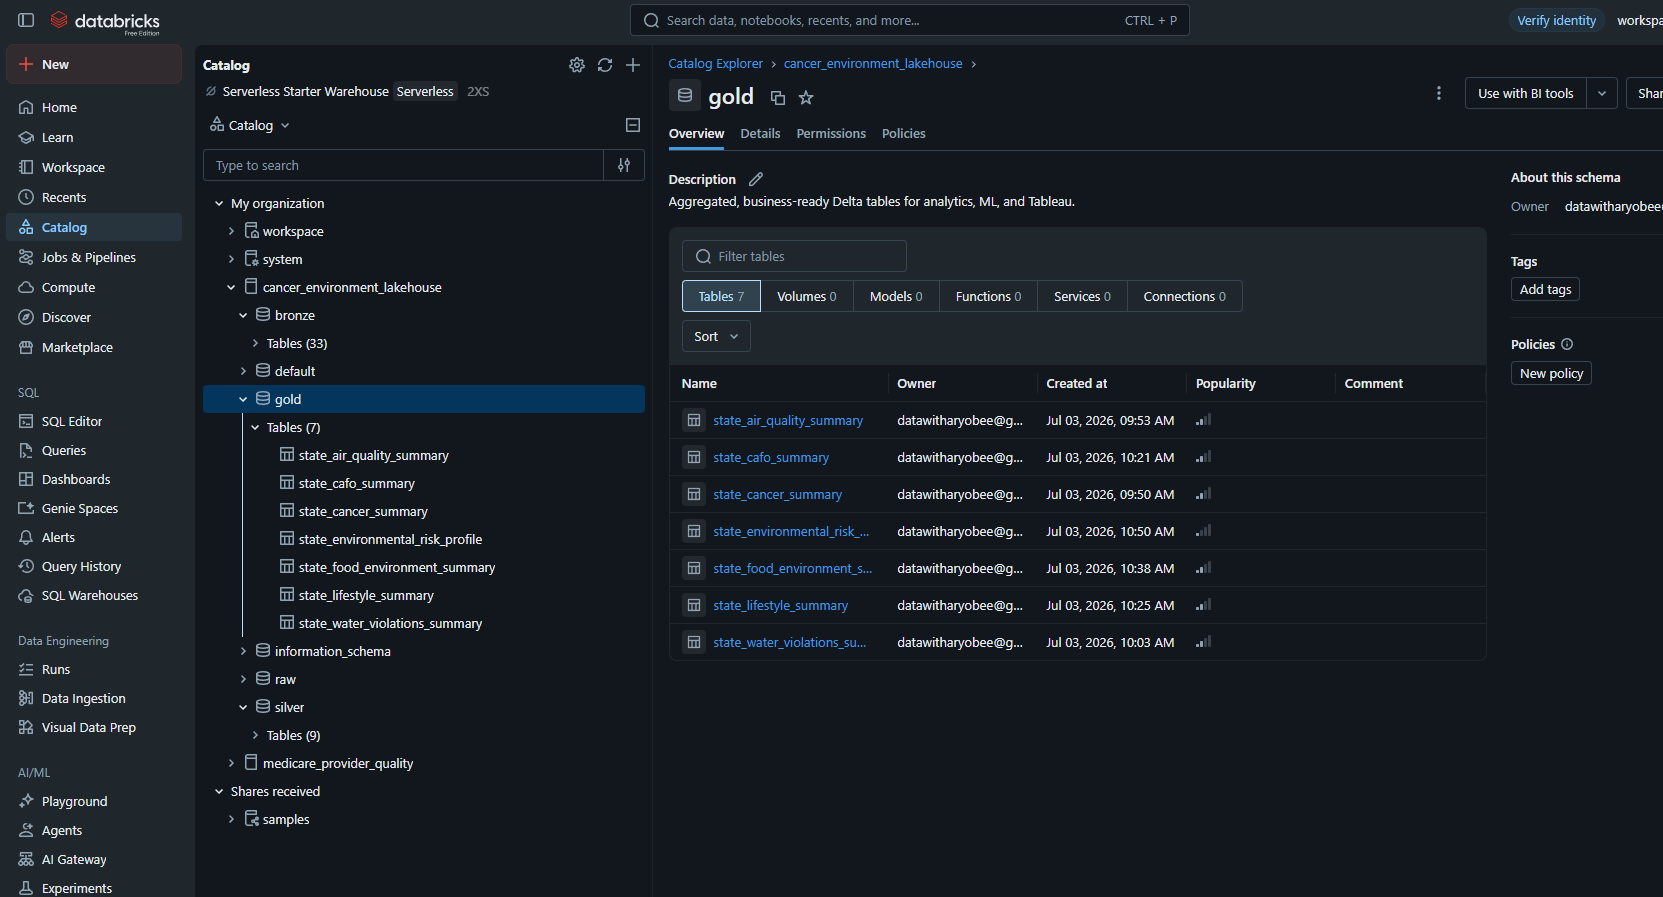
Gold layer tables in catalog
Gold Layer — Business Tables

The 7 Gold aggregated tables including the master state_environmental_risk_profile — the 51-state, 41-column analytical table feeding Tableau and ML.
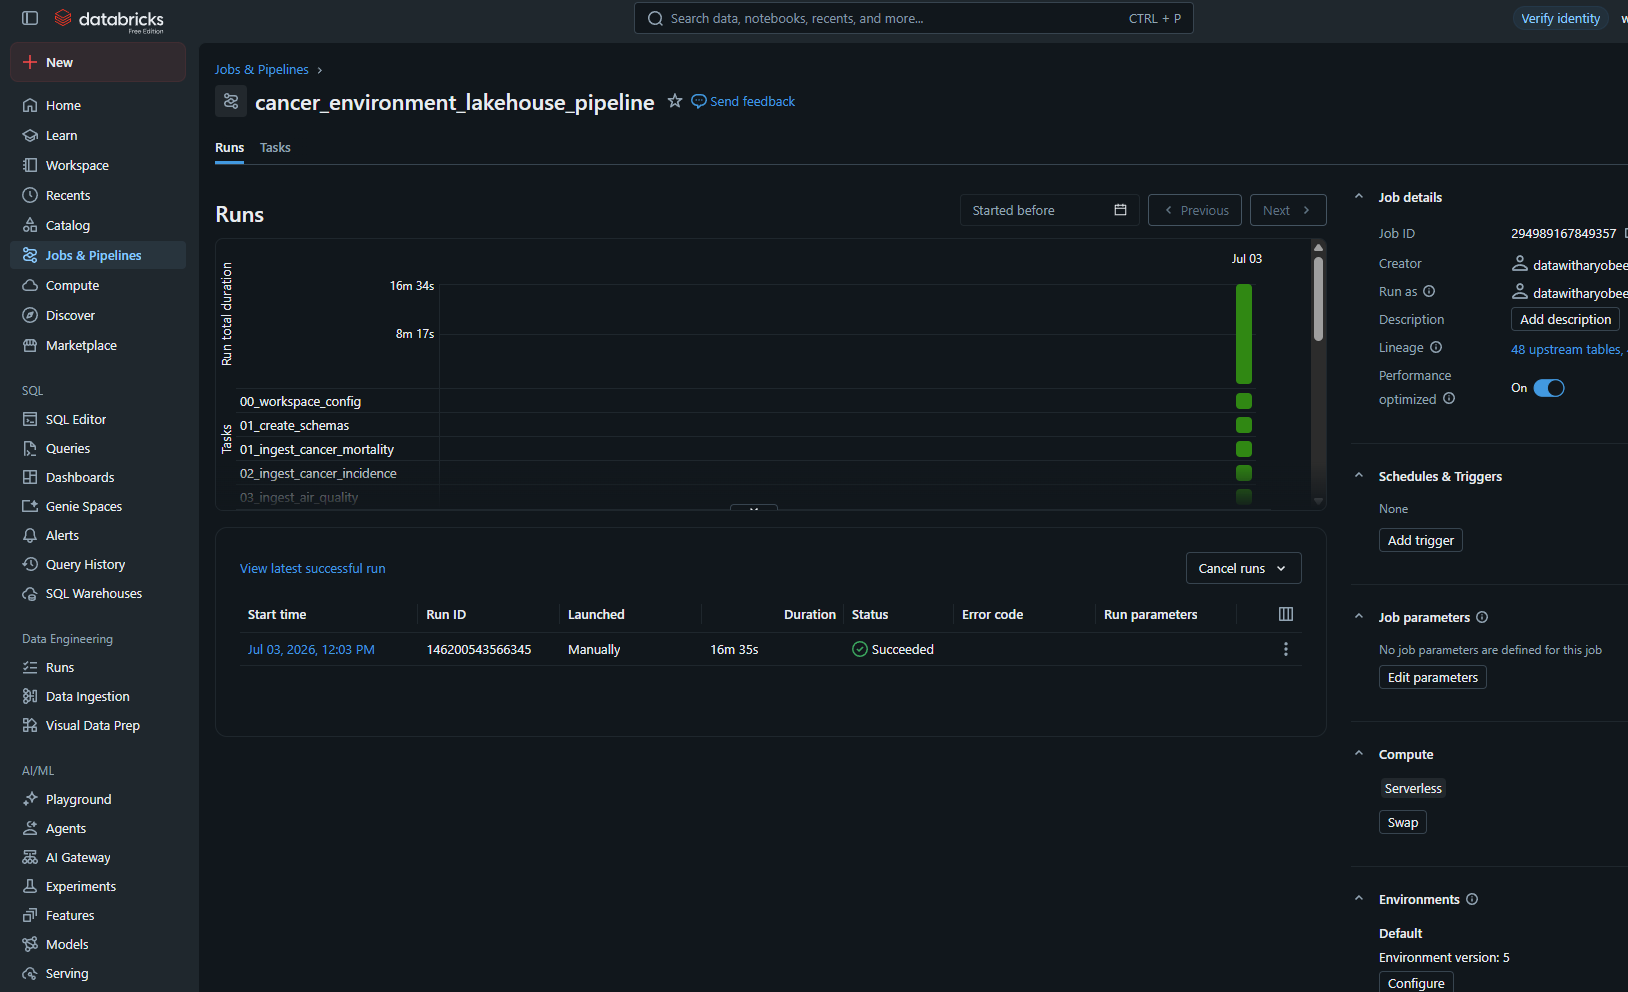
Jobs and pipelines run history
Pipeline Run History

Databricks Jobs & Pipelines view showing the successful pipeline run with 16m 35s duration and all tasks completed.


Key Findings

r=0.885
COPD — Strongest Cancer Mortality Predictor

COPD prevalence shows the strongest Pearson correlation with cancer mortality across all 51 states, reflecting the compounding effect of smoking-related lung disease and cancer risk. Smoking follows at r=0.846.

#1
PM2.5 — Top ML Feature for Cancer Incidence

Despite a moderate Pearson correlation (r=0.199), PM2.5 exposure days emerged as the single most important Random Forest feature (importance=0.28) — revealing non-linear effects missed by correlation analysis.

41/51
States with Declining Cancer Incidence

I compared early (1999–2005) vs late (2016–2022) cancer incidence averages. 41 of 51 states show declining rates over 24 years — but Tennessee (+40 rate points), Arkansas, and North Carolina are trending upward.

35%
West Virginia — Highest Mortality Burden

West Virginia has the highest mortality-to-incidence ratio at 35% — meaning roughly 1 in 3 cancer diagnoses results in death. Combined with 23.6% smoking rate and 40.8% obesity rate, it consistently ranks worst across all risk factors.

PM2.5 Days Nearly Doubled (2000–2022)

While overall AQI improved slightly from 41.2 to 38.6, PM2.5 exposure days nearly doubled from 83 to 151 annually. Air quality improvements in some pollutants are being offset by increasing fine particulate matter exposure.

R²=0.81
ML Model — Explaining Cancer Rate Variance

The Random Forest regression model explains 81% of variance in state cancer incidence rates using 13 environmental and lifestyle features. The model correctly classified all 16 high-incidence states (AUC=1.0) in the binary classifier.

Interactive Tableau Dashboards

Tools & Stack

Apache Spark
Apache Spark
Distributed processing for 52.8M rows across all pipeline stages
Delta Lake
Delta Lake
ACID transactions, time travel, and schema enforcement across all layers
Databricks
Databricks
Free Edition with Unity Catalog, serverless compute, and Workflows
Python
Python
PySpark, pandas, scikit-learn for all notebooks and ML models
scikit-learn
scikit-learn
Random Forest, Gradient Boosting, Ridge Regression, Logistic Regression
Tableau Public
Tableau Public
3 interactive dashboards — choropleth maps, scatter plots, bar charts
Unity Catalog
Unity Catalog
3-level namespace (catalog.schema.table) with managed Volumes
🔧
Databricks CLI
Bulk file uploads, DBFS operations, workspace management